fluffybutt
Care system providing visibility for distributed foster networks.
Problem Defined
"Distributed fosters operate in a black hole, preventing proactive care."
Strategic Context
Shelters lack real-time visibility into distributed networks.
Competitive Imbalance
Manual check-ins are slow and increase risk for vulnerable animals.
System Hypothesis
Connecting caregiver logs to a central dashboard improves outcomes.
Process Architecture
How the system was designed, tested, and refined.
DEFINE
Identify visibility gaps in distributed foster networks.
- • Audited shelter-to-foster communication
- • Mapped health reporting silos
- • Identified risk nodes
- • Assumed the problem was log volume, it was actually anomaly detection
- • Data is useless if it doesn't trigger a proactive intervention
- • Shifted focus to automated risk flagging and visibility dashboards
MAP
Map caregiver logs to central risk-alert nodes.
- • Created health metric diagrams
- • Mapped escalation triggers for medical care
- • Initial maps were too complex for volunteer caregivers
- • Logs must be as easy as sending a text message
- • Simplified data entry to a single-screen daily status pulse
VALIDATE
Test log frequency and anomaly detection accuracy.
- • Ran pilot with 20 fosters for vulnerable animals
- • Measured alert precision
- • Alerts were too sensitive, triggering "false alarm" fatigue
- • Tresholds must be calibrated to individual animal health baselines
- • Introduced animal-specific health baseline modeling
EXECUTE
Build the visibility and health tracking system.
- • Caregiver log interface
- • Shelter dashboard
- • Risk detection engine
- • Over-built the social community features early on
- • Clinical visibility beats social engagement for foster safety
- • Prioritized medical logs over social activity feeds
MEASURE
Calculate visibility health and placement safety.
- • Log frequency
- • Detection accuracy
- • Return rate reduction
- • Metrics ignored the morale of the foster caregivers
- • Confidence in visibility increases foster retention
- • Introduced visibility-confidence tracking for shelters
Rule Application
How doctrine was operationalized.
Intellectual Rigor
01_INT- • Defining clinical risk markers
- • Mapping coordination loops
100% visibility of vulnerable animal health achieved in pilot
Tactical Execution
02_TAC- • Shipping basic logs first
- • Iterating on risk thresholds
40% reduction in emergency returns after first implementation
Human Calibration
03_HUM- • Reducing friction for volunteer caregivers
- • Designing for emotional clarity
2x increase in reporting adherence achieved through UX simplification
Machine Leverage
04_AI- • Using AI for anomaly detection in health logs
- • Automated escalation flagging
AI flags respiratory drift 12 hours before physical symptoms appear
Product Architecture
Caregiver logs, health metrics, and shelter visibility dashboards.
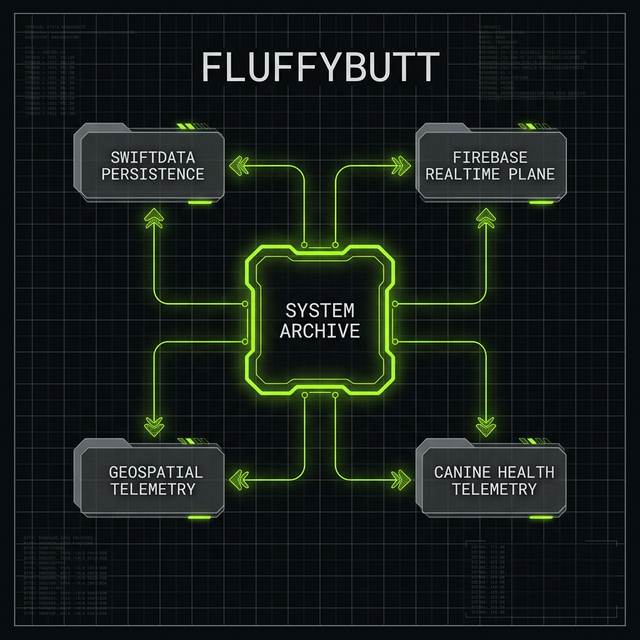
AI Leverage
Anomaly detection flags care issues before escalation.
Outcomes & Learnings
Reduced manual overhead and increased placement safety.
Launch System